In this session, “Parsing 5G Logs & Dashboard Creation (Introduction to Python Regex & MatPlotLib)”, we cover many concepts including parsing of text files and searching for specific data from them using Python Regular Expressions (RE commands or Regex). It also shows how to create plots and dashboards with the help of MatPlotLib in Python. So, this is not limited to Telecom only as it is something that is helpful in handling of big files and large amounts of data that would be difficult to parse manually.
I am also putting a sample of logfile below that you can copy in a text file to re-create your own data for this example.
sfn=300, slot=0, rsrp=-100, sinr=10, Throughput=355, PCI=100
sfn=300, slot=1, pktdropped=0, pktdiscarded=0, pktOOW=0, pktoutOfOrder=0
sfn=302, slot=0, rsrp=-101, sinr=9, Throughput=327, PCI=100
sfn=302, slot=1, pktdropped=0, pktdiscarded=0, pktOOW=0, pktoutOfOrder=0
sfn=304, slot=0, rsrp=-102, sinr=9, Throughput=333, PCI=100
sfn=304, slot=1, pktdropped=0, pktdiscarded=0, pktOOW=0, pktoutOfOrder=0
sfn=306, slot=0, rsrp=-103, sinr=8, Throughput=311, PCI=100
sfn=306, slot=1, pktdropped=0, pktdiscarded=0, pktOOW=0, pktoutOfOrder=0
Python (Session 3): Parsing 5G Logs & Dashboard Creation (Introduction to Python Regex & MatPlotLib)
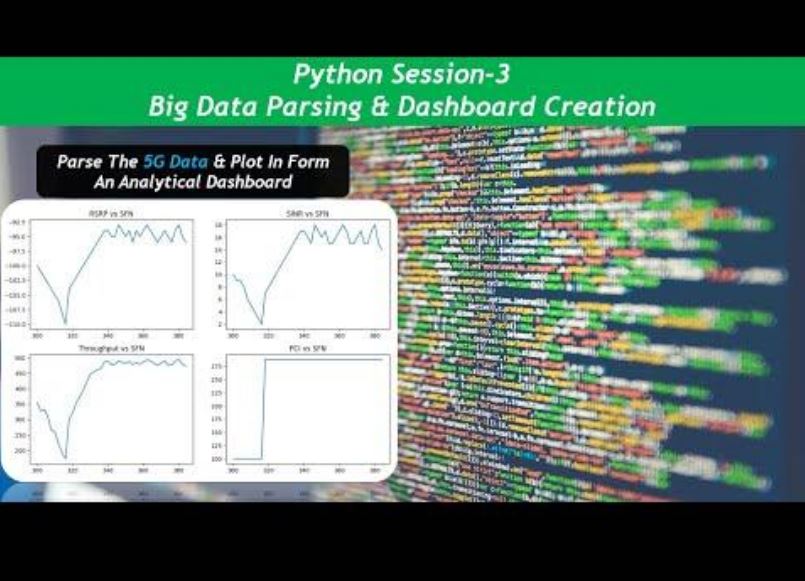
The video shows how to parse 5G Drive Test Logs and find relevant parameters along with their values. For instance, in this case, we could see that throughput (data rate), coverage (RSRP) and quality (SINR) of the mobile device was going down and then after some time, it starts increasing and then gets stable. So, after plotting the parameters we could see that mobile device changed its cell as we can see that the PCI changed from 100 to 288.
Similarly other parameters can be extracted like packet losses, uplink throughput, Resource Block allocations, Block Error Rates, Transport Block Size and PDCCH DCI information. All of this can be plotted and it can make processing very fast and the end-user can quickly find out the issues in the drive.
Having said that, this is not limited to 5G Drive Test Logs as this procedure can be applied to any form of data. It can be done on network logs, pcaps extracted to text, Layer-3/Layer-2 logs and any other form of big data. As long as we know what to look for in the data, we can automate the processing and reduce the time consumption.
In the next session, we will discuss how to make it intelligent such that the program not only parses the logs but also help in making decisions and recommendations for improvement to the end-user.
I am also putting code here, if anyone wants to copy it directly
import re
import matplotlib.pyplot as plt
FileImport=open(“5gLog.txt”,”rt”)
v=0
RSRP=[]
SINR=[]
THROUGHPUT=[]
FrameNum=[]
PCI=[]
for line in FileImport:
if “rsrp” in line:
v=v+1
print(v)
rsrp1=re.findall(‘rsrp=’ ‘-?\d+’, line)
rsrp2=re.findall(‘-?\d+’,str(rsrp1))
sinr1=re.findall(‘sinr=’ ‘-?\d+’, line)
sinr2=re.findall(‘-?\d+’,str(sinr1))
Thp1=re.findall(‘Throughput=’ ‘-?\d+’, line)
Thp2=re.findall(‘-?\d+’,str(Thp1))
sfn1=re.findall(‘sfn=’ ‘-?\d+’, line)
sfn2=re.findall(‘-?\d+’,str(sfn1))
pci1=re.findall(‘PCI=’ ‘-?\d+’, line)
pci2=re.findall(‘-?\d+’,str(pci1))
RSRP.append(int(rsrp2[0]))
SINR.append(int(sinr2[0]))
THROUGHPUT.append(int(Thp2[0]))
FrameNum.append(int(sfn2[0]))
PCI.append(int(pci2[0]))
print(RSRP)
print(SINR)
print(THROUGHPUT)
fig, graph= plt.subplots(2,2)
graph[0,0].plot(FrameNum,RSRP)
graph[0,0].set_title(‘RSRP vs SFN’)
graph[0,1].plot(FrameNum,SINR)
graph[0,1].set_title(‘SINR vs SFN’)
graph[1,0].plot(FrameNum,THROUGHPUT)
graph[1,0].set_title(‘Throughput vs SFN’)
graph[1,1].plot(FrameNum,PCI)
graph[1,1].set_title(‘PCI vs SFN’)
plt.show()
In case you have any queries or want to connect with Ali Khalid, please feel free to drop a comment or follow him on LinkedIn. Also, if this has been helpful, then please subscribe to our Youtube channel – Our Technology Planet for more exciting stuff and videos.
Ali Khalid
Latest posts by Ali Khalid (see all)
- 5G Coverage Expansion Analysis – Find The Optimal 5G Coverage Threshold For Your Network - November 9, 2024
- 5G Coverage Expansion - November 9, 2024
- 5G SA Cell Search & Network Entry Matrix - July 18, 2023